
The Taxon-Independent Community Index
Background
Global declines in habitat quality and biodiversity continue to worsen from over exploitation of natural resources and intensive land use. High-profile ecological disasters and extinctions receive widespread attention, but the gradual and less perceptible shift in overall ecological health arguably poses a far greater threat. These gradual whole-ecosystem changes may go unnoticed or be ignored until a major change or tipping point occurs, due to the limited way in which we monitor these systems.
Biological communities are products of their environments and the unique stressors present. They therefore contain a time-integrated picture of the state and quality of a system. Understanding this information is complex and often relies on knowledge of the morphology and behaviours of a select group of ‘indicator’ taxa (ie. macroinvertebrates, fish, and diatoms). A biological index is calculated from this information for ease of communication, reporting, and comparability. This method is time consuming, labour and cost intensive, and spatially, temporally, and ecologically limited.
Environmental DNA (eDNA) approaches have been recognised as a powerful way to overcome some of the above limitations of morphology-based biological assessments. However, applying metabarcode data in this way often ‘shoehorns’ the information into rigid biological indices. As a result, information from lesser studied or understood taxa groups is often disregarded and information is biased against smaller, more sensitive, and faster generating taxa. Moreso, it disregards the information unable to be taxonomically assigned - a significant hindrance to traditional metabarcoding techniques due to their reliance on incomplete reference databases.
Recent international research has investigated ways to better utilise this unassigned information by applying machine learning approaches, however, most so far have focused on individual taxon groups such as bacteria and diatoms. Off the back of a large eDNA validation trial carried out by New Zealand’s regional councils with technical support from Wilderlab, we explored the feasibility of a taxon-free, whole-ecosystem biotic index of riverine ecological health.
Our approach
During the summer 2020/2021, New Zealand’s regional council staff surveyed 53 well-known rivers and streams across the country (see Figure 1, read more about this trial here), spanning a range of habitat types and hydrological characteristics. Most of the sites (40 out of 53) also had five-year median macroinvertebrate community index (MCI) data available. We used data from 8 eDNA metabarcoding assays processed from 16 samples taken per site (n = 848) to train a taxonomy-independent community index (TICI).
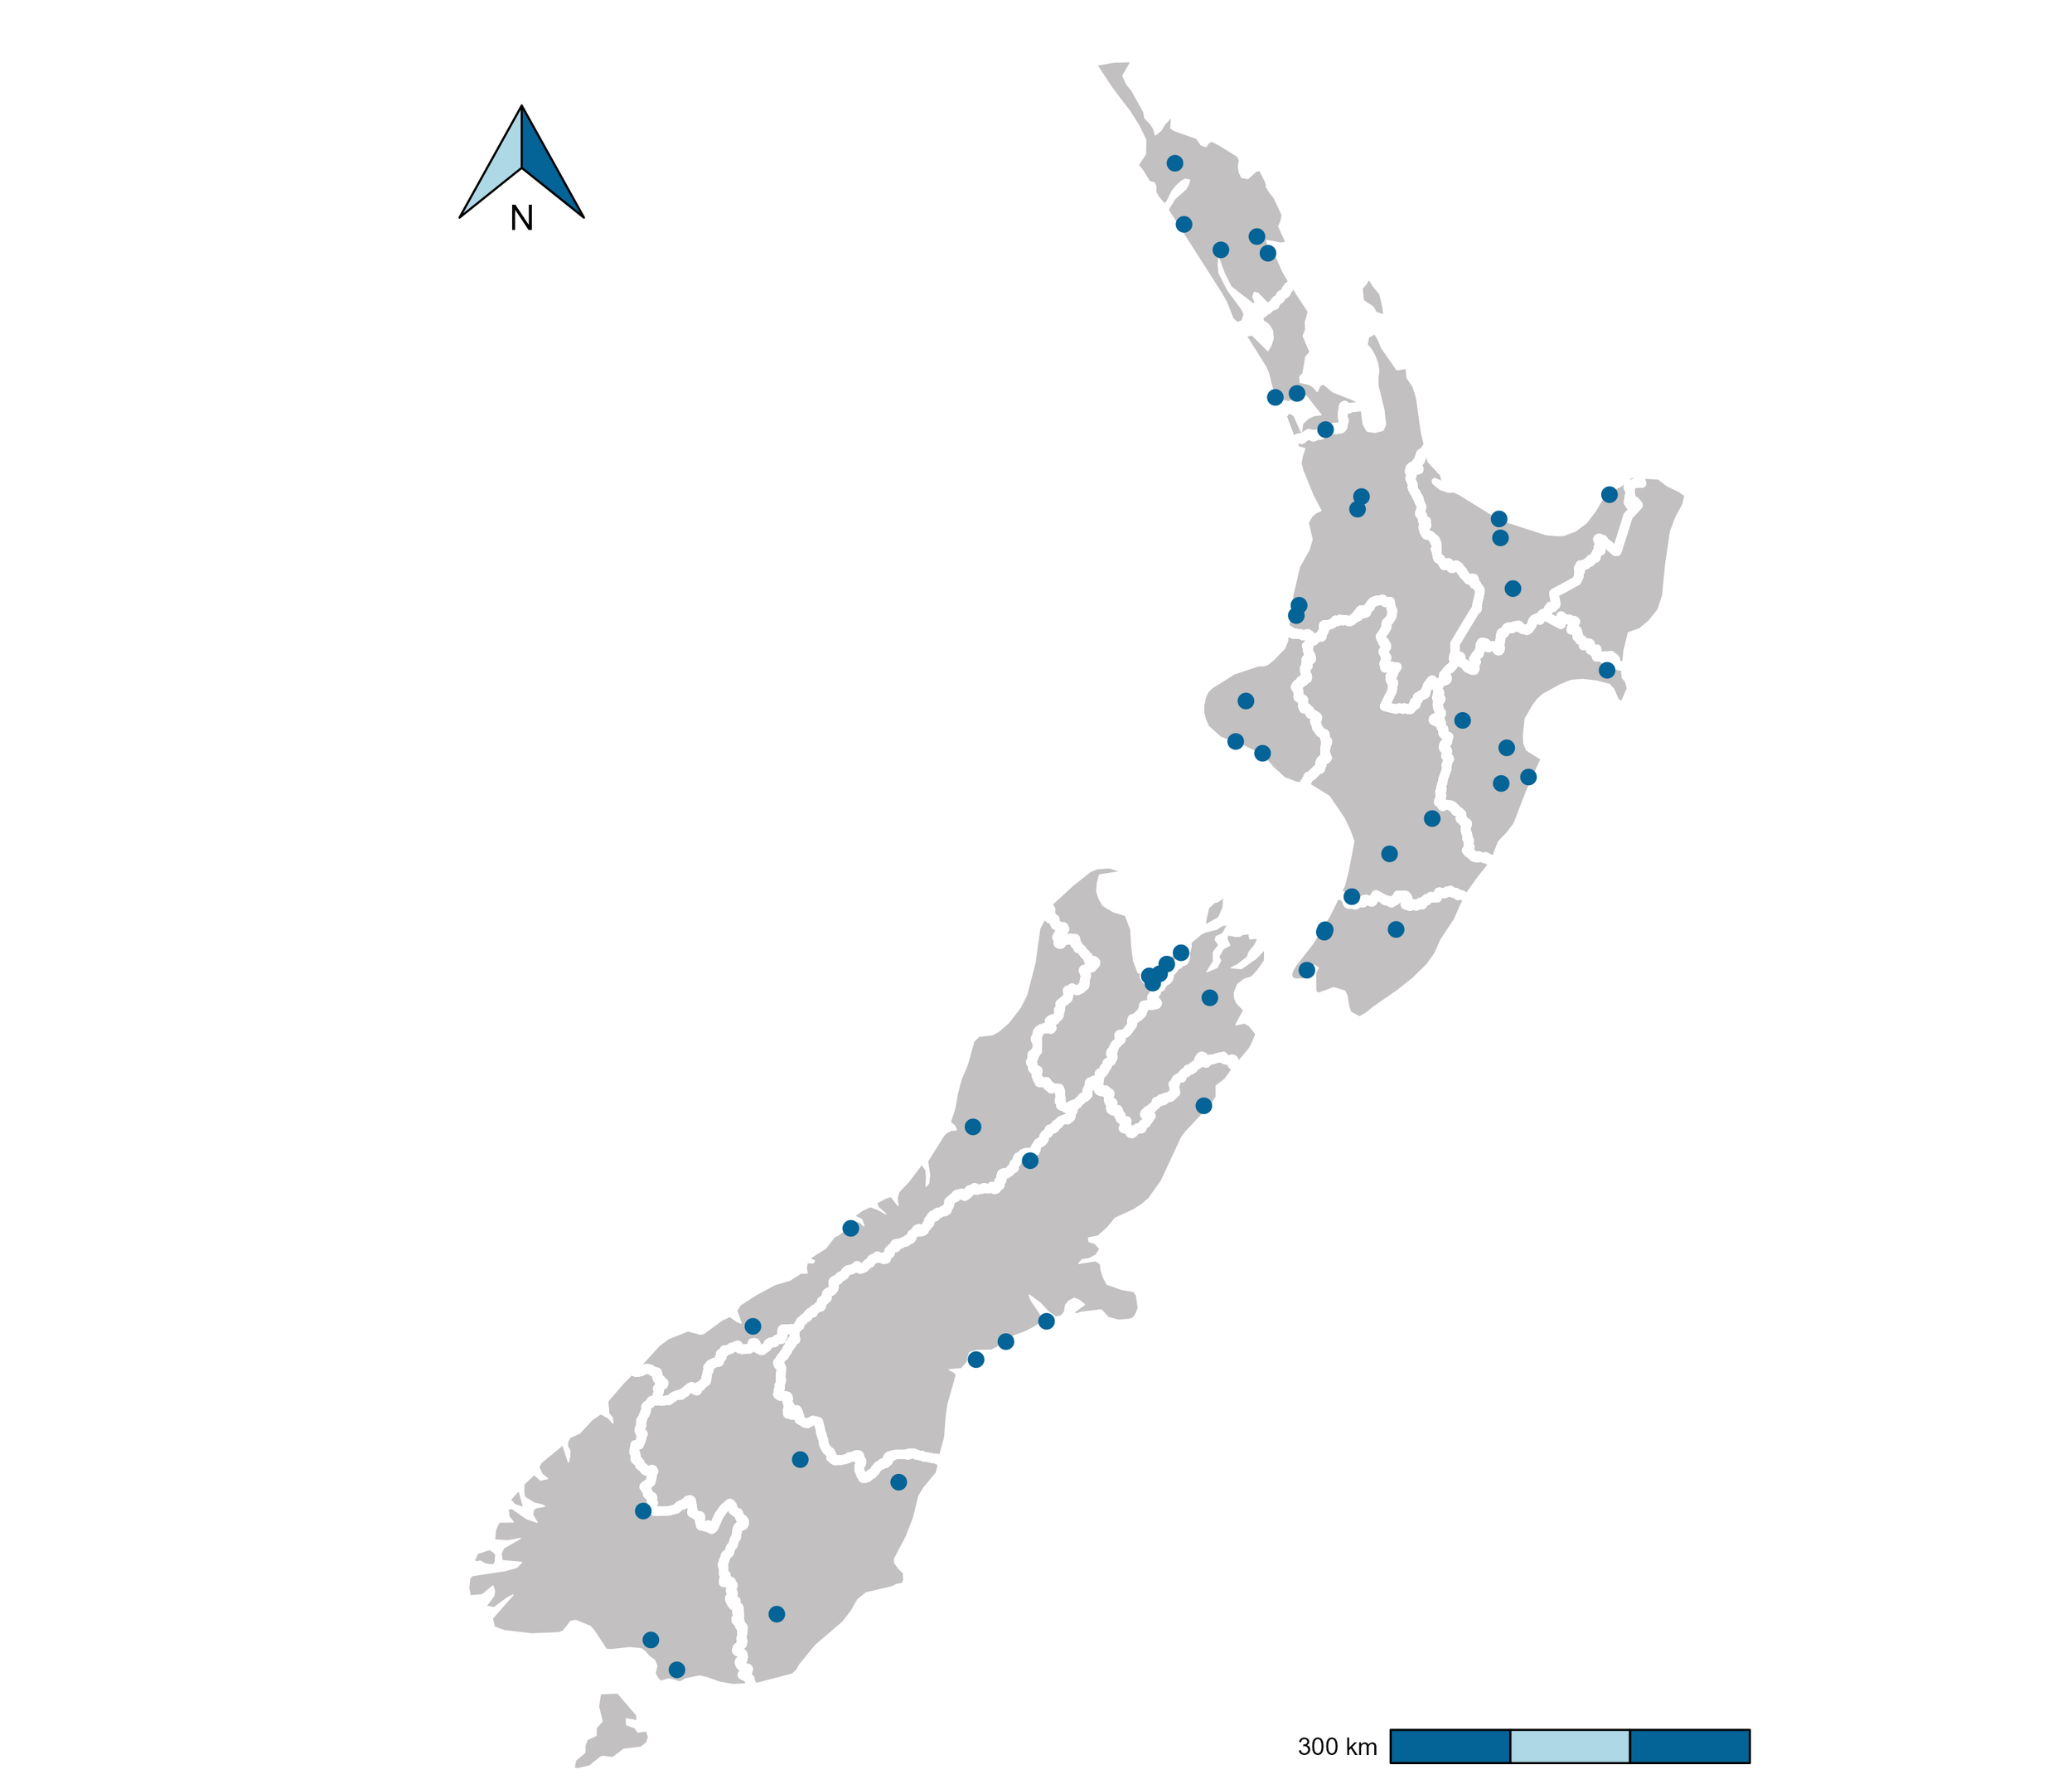
Figure 1: Map of all 53 sample sites (blue dots) included in the high replicate study collected between December 2020 and May 2021. White boundary lines mark regional authority boundaries.
Building the model
Across the 848 eDNA samples, the 3000 most commonly encountered sequences were selected as TICI indicators and assigned indicator/tolerance values using the Chessman rank iteration process. The major difference between our approach and the method used in calculating the NZ MCI tolerance scores was that we assigned indicator values to amplicon sequence variants (ASVs) rather than macroinvertebrate taxa.
While this means that a single taxon can appear multiple times in the indicator list (eg through multiple assays detecting the same species, or intra-specific or intragenomic variation), the large number of indicator sequences spread across the tree of life minimises the effect of individual taxa, irrespective of whether they are over-represented in the indicator list.
In our application of the Chessman process, the 53 sites were initially ranked from most impacted to most pristine based on the mean molecular MCI value, then iteratively reranked until model convergence. A TICI score is calculated for each sample as the mean indicator score of the indicator sequences detected. To assist with interpretation and to bring this score to a scale consistent with the existing NZ MCI, it is multiplied by 20. To ensure the model was independent of the initial site ranking of the model parameters, we repeated the initial iterative ranking procedure on 10 randomised initial site-condition rankings. All models converged on a solution where the 3000 indicator values were either identical (2 of 10) or almost identical (R2 = 0.99; 8 of the 10 permutations) to the molecular MCI-guided TICI model.
Validation
To ground-truth the TICI, we correlated TICI scores against five-year median MCI scores for each site where data was available (40/53 sites). A strong correlation (p < 0.001; adj R2 = 0.856; Figure 2) was seen, indicating that the TICI follows a similar response pattern to the NZ MCI.

Figure 2. Validation of TICI against existing five-year median kicknet MCI values, with TICIs from 640 individual samples plotted against their kicknet MCI site-medians. Fitted linear model of five-year median kicknet MCI versus site-averaged TICI values (shown as black crosses), p < 0.001, adj R2 = 0.856.
It was also important to explore the influence of different land uses (urban, high intensity agriculture, low intensity agriculture, and native bush) on the site’s final TICI scores at different spatial scales (2 km, 5 km, 10 km, and total upstream cover). We found that urban, all agriculture, and native bush cover, in the immediate 2 km upstream from the sample site, were the most influential in driving site TICI scores, demonstrating the ability to detect these human disturbance gradients at a relatively localised scale. Future work will interrogate this response gradient alongside additional water quality and physiological parameters.
The number of TICI sequences detected per sample varied by site, with an overall average of 373 (sd 135). There was minimal variability between the TICI values of replicate samples (mean CV = 0.0125), indicating the scoring was robust. In addition, the indicator scores of the TICI sequences detected in each sample were approximately beta distributed, with scores skewed towards zero in highly impacted sites and skewed towards one in more pristine reference sites (see examples in Figure 3).
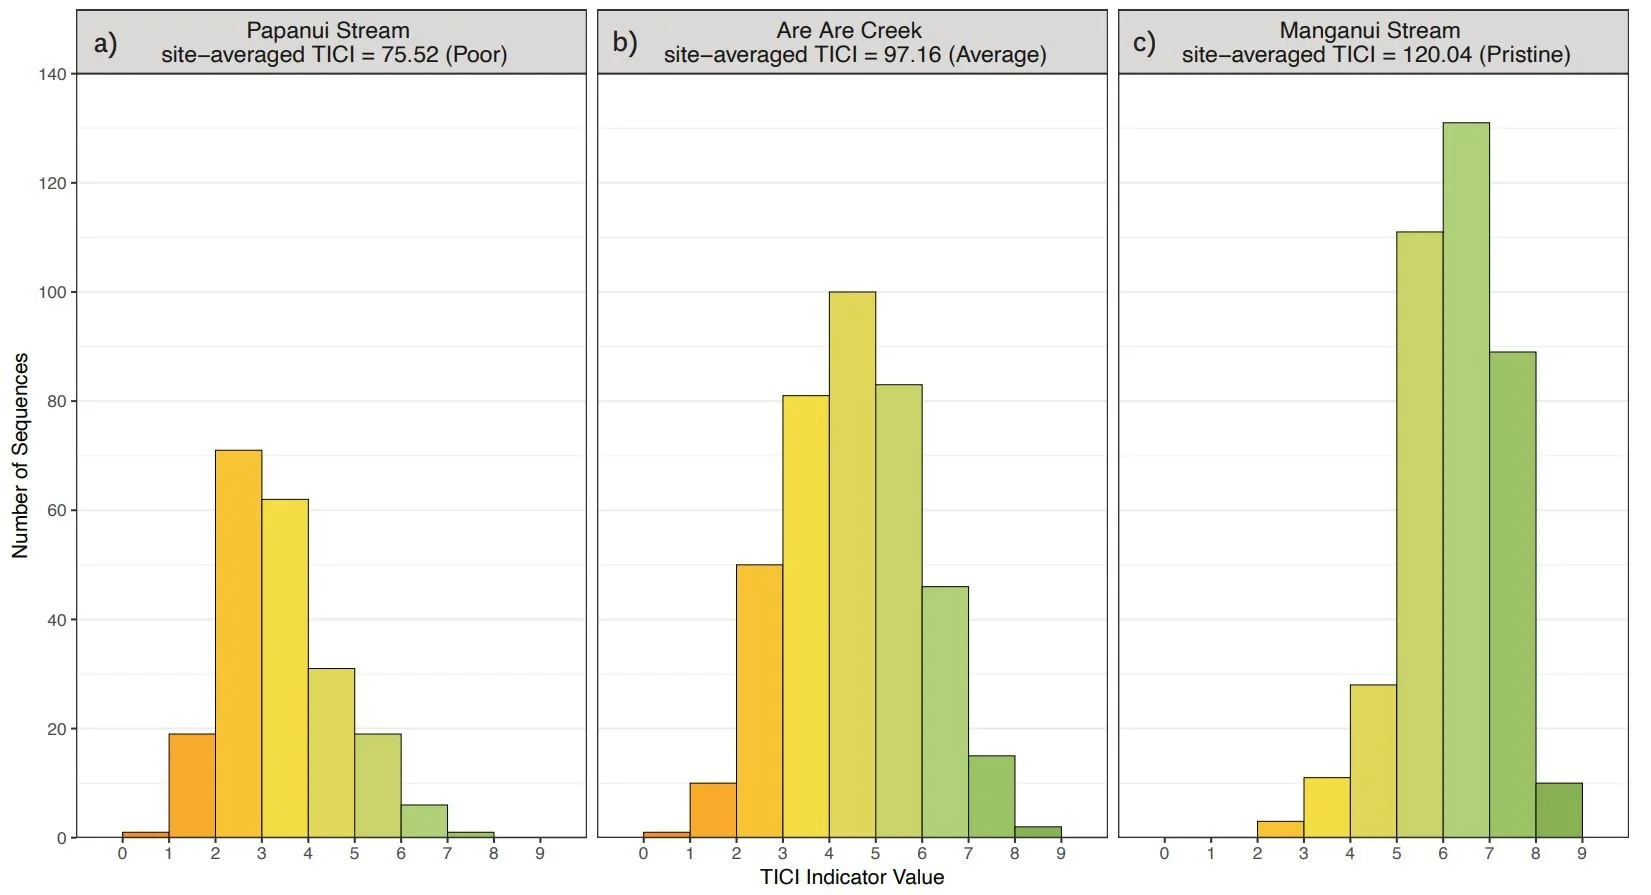
Figure 3: Distributions of TICI indicator scores for representative eDNA samples taken from a poor (a), average (b) and pristine site (c). Representative sites are from Papanui Stream in Hawke’s Bay (site-averaged TICI = 75.52), Are Are Creek in Marlborough (97.16), and Manganui Stream in the Southern Waikato Region (120.04), respectively.
Of the 3000 most commonly encountered sequences (in terms of sample occupancy), taxon assignment was able to identify 51 phyla, 100 classes, 236 orders, 344 families, and 396 genera.
Using the few hundred sequences that were able to be taxonomically assigned, we compared the assigned indicator values along the tolerance score scale as a ‘sanity check’ to ensure values were ecologically expected. For example, the sequences that were associated with poor stream condition were dominated by oligochaete worms, including Bothrioneurum vejdovskyanum (indicator value = 1.08), Potamothrix bavaricus (1.42) and Ilyodrilus sp. (1.99). Whereas high scoring sequences included several ‘EPT’ taxa (mayflies, stoneflies and caddisflies; order: Ephemeroptera, Plecoptera and Trichoptera, respectively), including Nesameletus sp. (8.91), Psilochorema macroharpax (8.03) and Ameletopsis perscitus (7.92). Scattered amongst these well-known species sit the majority of indicator sequences at varying levels of taxonomic assignment, though their newly identified indicator value generated throughout the machine-learning process allows them to be interepretted (see this illustrated in Figure 4).

Figure 4: Graphic displaying the distribution of known and unknown sequences along an impairment gradient from ‘Very Poor’ to ‘Pristine’ ecological health.
The riverine taxon-independent community index
Since June 2022, Wilderlab provides TICI scores for all NZ riverine samples processed with our comprehensive freshwater assay panel to assist in our clients ability to gauge and track the ecological health of waterways (see examples in Figure 5a-c).
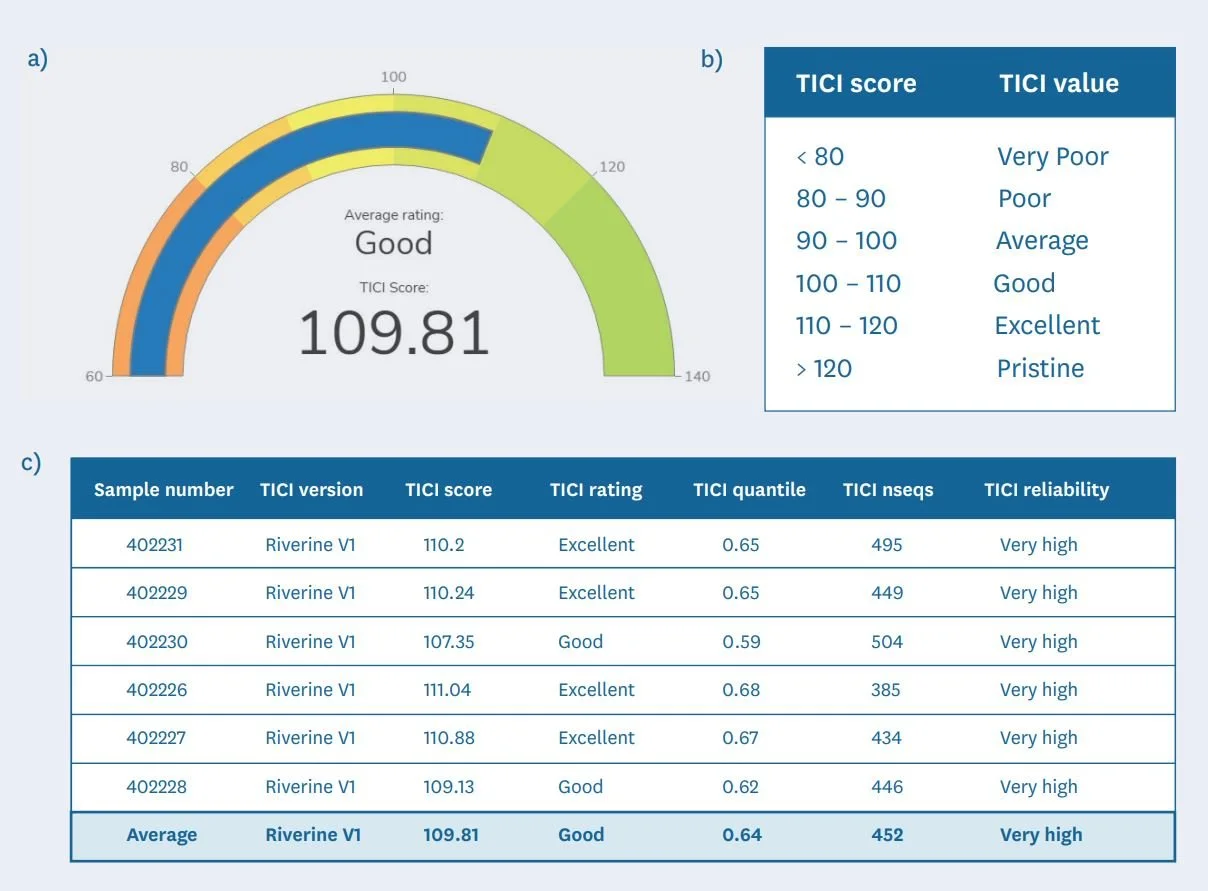
Figure 5: An example of a TICI results output of a 6-replicate sample from a headwater tributary of the Pauatahanui Stream in Wellington. This includes a) a display dial to make reporting more engaging, b) a qualitative ranking on the same scale as the NZ MCI-hb, and c) a breakdown of the TICI parameters per sample to assist with interpretation.

Figure 6: Graphic illustrating the way TICI scores follow the continuum of ecological health under different land uses as the ecological community reflects the stressors each land use exerts on the system.
Read the full paper here:
Wilkinson SP, Gault AA, Welsh SA, Smith JP, David BO, Hicks AS, Fake DR, Suren AM, Shaffer MR, Jarman SN, Bunce M (2024). TICI: a taxon-independent community index for eDNA-based ecological health assessment. PeerJ. DOI: 10.7717/peerj.16963